Trading journal
Read your results account by account or across all accounts, find where you win and where you lose, and spot the habits that cost you.
8 min read · Version 1.2.51 · updated 29 September 2026
- Choose the account, the period and the tags being analysed
- Read the key metrics and know exactly what they measure
- Tag, annotate and export your positions, and produce a PDF report
- Interpret bias detection and the Monte Carlo simulation
Open the journal
Laboratory > Trading Journal. Three tabs at the top of the page:
- Trading
- Your positions and every analysis in this chapter.
- Investment
- Your crypto spot portfolio, see below.
- Challenges
- Your prop-firm accounts: progress and profitability, see Prop firms and challenges.
The account selector picks one account or the All-Data account. The period is set in one click (day, week, month, year, full history) or with custom dates. Filter by tags restricts every analysis to the positions carrying certain tags.
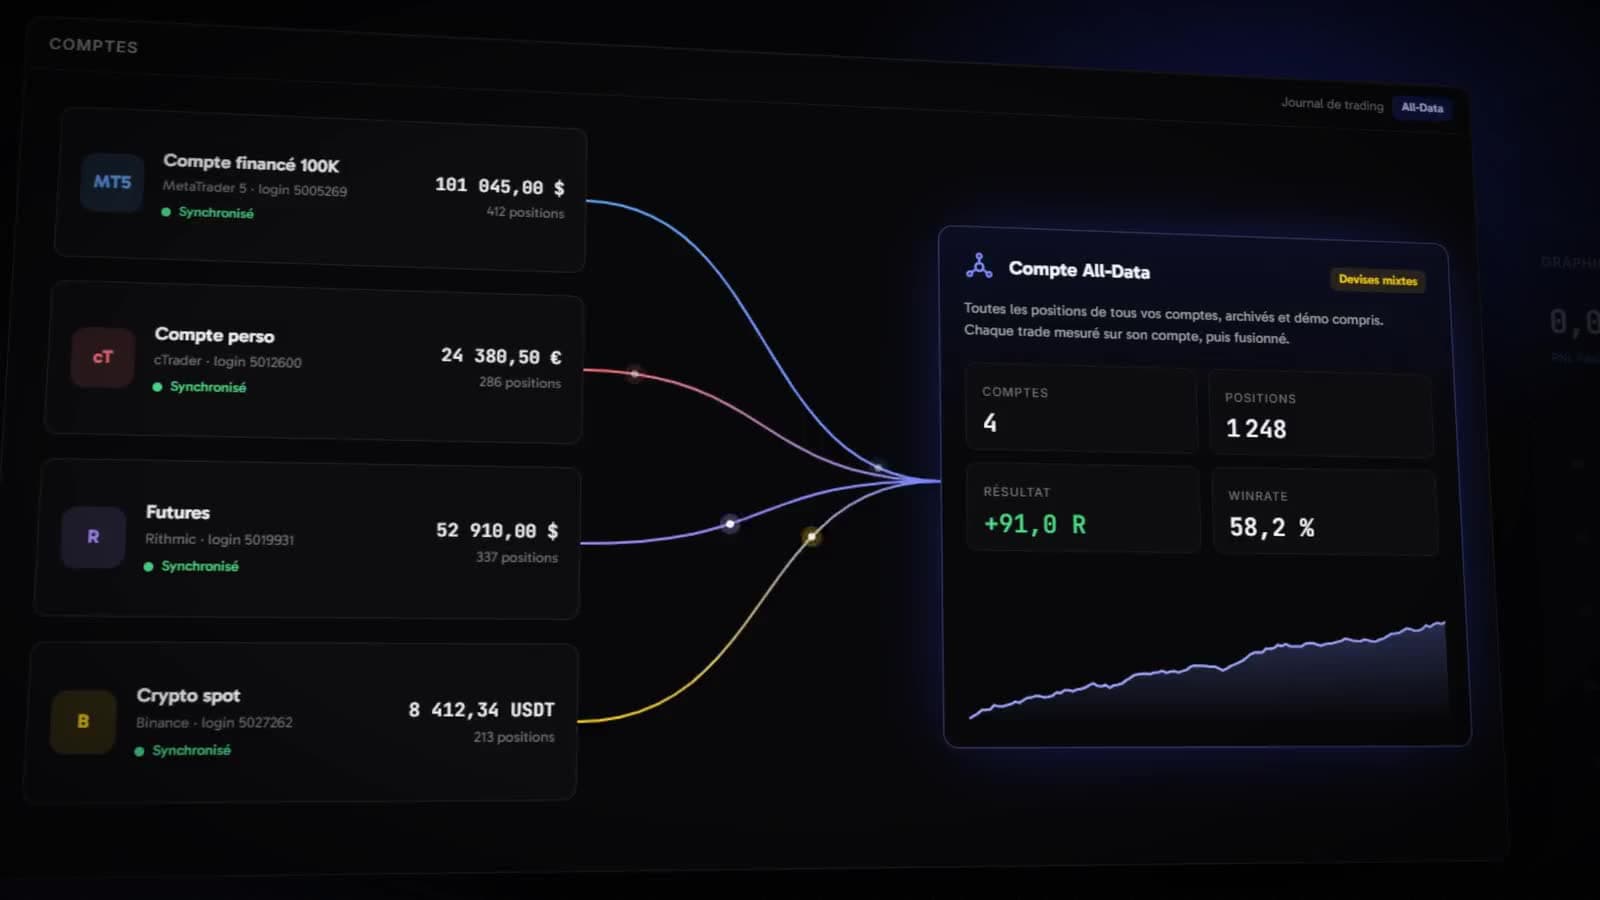
The All-Data account
It gathers the positions of all your accounts, archived and demo included. Each trade is first measured as a percentage and in R of the account that took it, then the accounts are combined in time order. The same trading decision copied to several accounts counts once, on the master account when there is one; the discarded positions stay visible in the CSV export.
Currency amounts only show when all your accounts share the same currency. Otherwise the view sticks to R and percentages, and the screen shows Mixed currencies.
The key metrics
The top strip sums up the period. Each figure is compared with the previous period (vs prev.).
- Profit factor
- Sum of gross gains divided by the sum of gross losses, in absolute value. Above 1, you win more than you lose.
- Expectancy per trade
- Average net result per closed trade, fees included, in R and in currency.
- Max winning streak
- Longest run of consecutive winning trades.
- Max losing streak
- Longest run of consecutive losing trades.
- Top 5 trades share
- Share of your total result brought by your five best trades. A high value means performance concentrated on a few shots.
- Exit efficiency
- Average percentage of the maximum floating gain (MFE) you actually capture on your winning trades.
Performance curve and hexagon
The performance chart plots your result over time, with realised figures and floating extremes: the maximum floating gain and maximum floating drawdown reached while positions were open. It shows what your positions went through, not only where they ended.
The social hexagon places your profile on five axes (win rate, RR, drawdown, number of positions, risk) and overlays the average Kara user.
Open positions and history
Current live positions lists your open positions, with the price and the risk-engine rules applied to them (virtual stop and target, break-even, partial exits). You can close a position, fully or partly, by percentage or by volume. Pending orders lists your unfilled orders.
Historical positions is the table of all your closed trades: time, symbol, ticket, side, volume, entry, SL, TP, exit, profit, commissions, tags and images. For each position:
- Tags: up to 20 per position, from 50 tags you define (setup, session, mistake…). They feed
Performance by strategy tagand the tag filter. - A comment of 500 characters and up to 5 images (1 MB each): a screenshot of your analysis, the market context.
- Stop moves: the history of SL and TP changes over the life of the position.
Read your performance
Below the table, each panel answers a precise question:
- Win rate
- Share of winning positions, by symbol. Results below 0.2% of the balance are not counted: a trade closed at zero is neither a win nor a loss.
- Return
- Net or gross, by day, week, month, day of the week, and by session (London, New York, Tokyo).
- Drawdown
- Realised or floating, read position by position or over time.
- Reward / Risk
- The actual RR (average gain divided by average loss) against the intended RR (from the stops and targets you had set). The gap tells you whether you stick to your plans.
- Sharpe, Sortino, Calmar
- Return relative to volatility, to downside volatility only, or to maximum drawdown. Your Sharpe is compared with the users' average.
- MAE / MFE
- Maximum adverse and maximum favourable excursion of each position: how far it went against you, and in your favour, before the exit.
- Risk / Reward distribution
- How your results spread in R, with or without break-evens.
- Gains calendar
- Day-by-day result, in currency or in R, with best day, worst day and active days. Clicking a day opens its trades.
- Temporal heatmap
- Average R or win rate by day and hour, in local time, with your best and worst slot. Each cell needs a few trades before it shows.
- Performance by symbol
- Your instruments ranked, by result or in R.
- Duration × result
- Each trade placed by holding time and result in R, with the trend. Shows whether your long trades pay or cost.
- Time under water
- Cumulative time spent below your previous peak, and the longest period under water.
- Fees summary
- Commissions and swap, in total and per position.
- Tax summary
- Trading turnover and net transfers to your own accounts, to prepare your tax return.
- Performance by strategy tag
- Win rate and result of each tag: the most direct way to know which setup makes you money.
Psychological bias detection
From 10 closed trades, Kara analyses the sequence of your trades and spots eleven biases. It derives a hygiene score out of 100, with its trend over the last 30 days.
| Bias | What Kara looks for |
|---|---|
| Revenge trading | Re-entry less than 10 minutes after a loss, on the same symbol or with an inflated size. |
| Post-loss escalation | Size at least double that of the previous loss, within 24 hours. |
| Overtrading bursts | Days with at least twice your usual number of trades. |
| Winners cut too early | Winners closed below 50% of a potential (MFE) larger than your average gain. |
| Losers left to run | Losses of at least twice your average loss, closed without the stop being hit. |
| Disposition effect | Your losses are held much longer than your gains. |
| Gains given back | Trades that ended red after a floating gain at least twice the final loss. |
| No stop loss | Positions with no stop detected. |
| Erratic risk | Very irregular realised loss sizes. |
| House-money oversizing | Size inflated after three consecutive wins. |
| Late-night trading | Entries between midnight and 5 am, local time. |
Why?explains each signal with your own numbers: your usual re-entry delay against the one observed, for instance.- The cost of each bias is estimated in R over the period. Costs do not add up: one position can feed several biases.
Tag the new onesputs a tag on the positions concerned, so you can find and filter them.- Six good habits are recognised too: systematic stops, consistent sizing, patience after a loss, stopping after a red streak, winners held, journal kept.
Monte Carlo simulation
From 30 closed trades, the journal projects what your trade distribution can produce next. Two views:
- Heatmap
- Your trades drawn at random with replacement, at a fixed risk of 1% of initial capital. The density of simulated paths shows where you are most likely to be in N trades.
- Prediction curve
- Same draw, but each gain applies to the running balance, like an account whose position size follows equity. Median and p5-p95 and p25-p75 bands.
The simulation also gives the probability of reaching given levels, and of hitting a prop-firm target before the loss limit.
PDF report and CSV export
- PDF report: for the period and accounts shown, it gathers net result, positions, success rate, profit factor, expectancy, maximum drawdown, average gain and loss, fees, streaks, balance evolution, result by month and by symbol, and your best and worst positions. Every page states that the data comes straight from your accounts and cannot be edited.
- CSV export (
Export): every position in the table, with gross and net P&L, commissions, swap, gain in %, R, close reason and balance after exit. In the All-Data view, positions discarded as copy duplicates are included with the original position.
The Investment tab
For a crypto spot account, this tab follows your portfolio as an investor, not as a trader: holdings with average price and floating P/L, allocation, cumulative P/L, performance against a reference asset (base 100), holding time, best and worst assets, fees.