Economic terminal
See releases coming, measure what each one did to your asset, and read the context: seasonality, company earnings, US markets, options flow.
3 min read · Version 1.2.51 · updated 29 September 2026
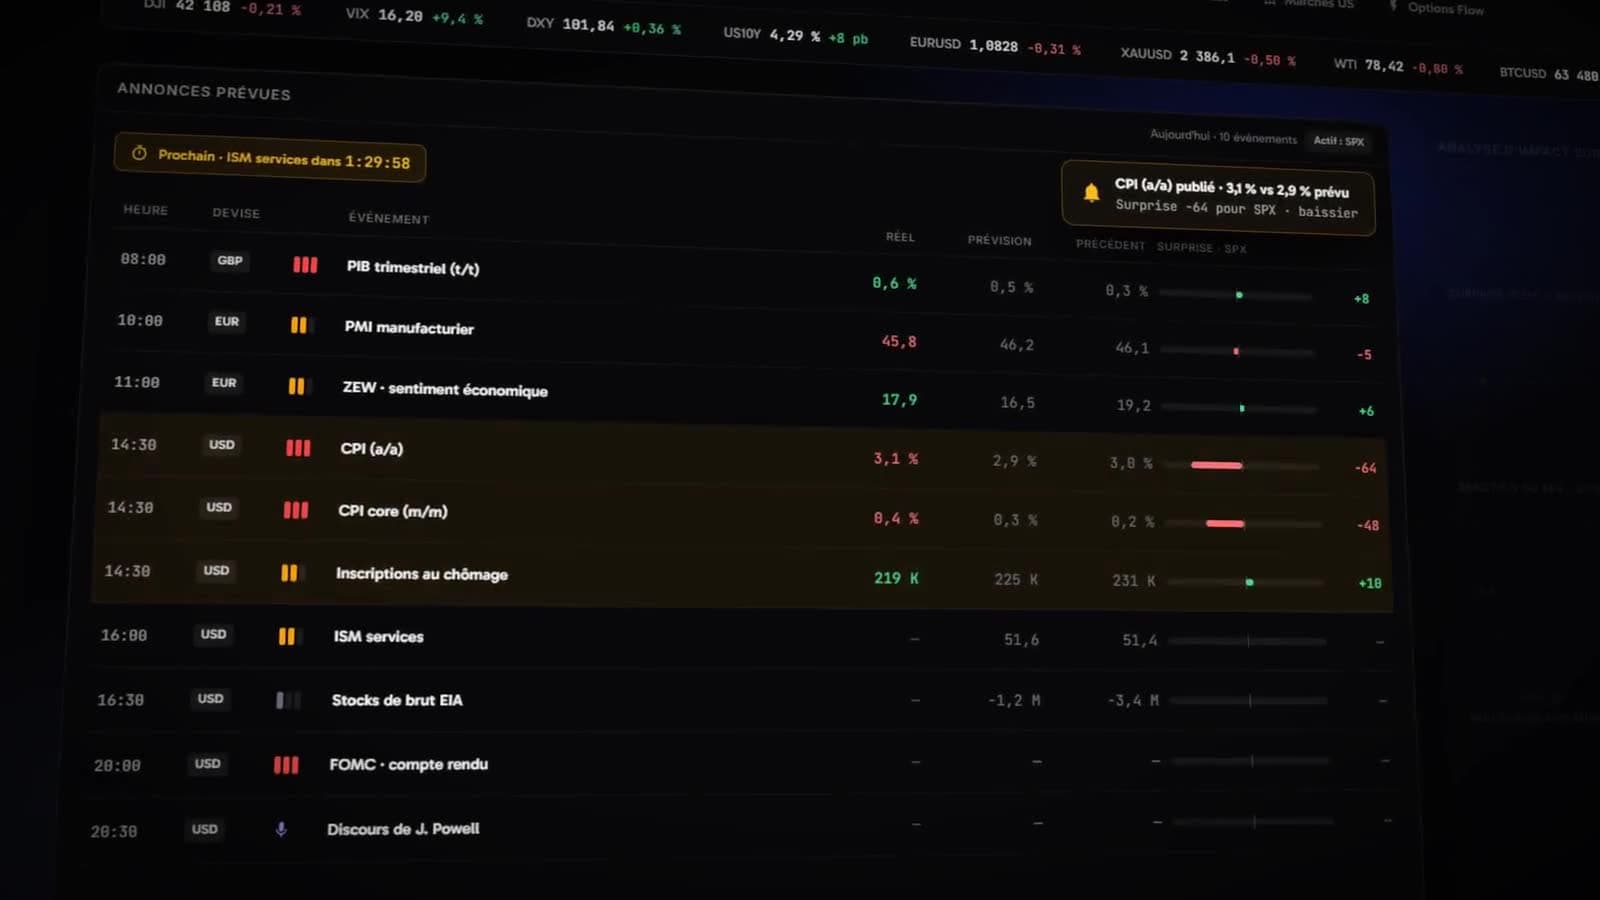
- Pick an asset and show only the useful tabs
- Read the historical impact of a release on your asset
- Use seasonality, earnings and options flow
Choose the asset
Laboratory > Economic Terminal. Everything starts from the asset chosen at the top of the page: search it by name, symbol or keyword. Its price shows next to it.
Releases and news are filtered for that asset: by the pair's currencies for forex, by the reference currency for an index, by the factors that move it for a commodity.
The terminal has seven tabs: Calendar, Seasonality, News, Earnings, Dividends, US Markets and Options Flow. Visible tabs hides the ones you do not use. Earnings and Dividends only appear for a stock.
Calendar
The list of scheduled releases (GDP, inflation, employment, central bank decisions…), with their impact, the consensus and the countdown to the next one. Key releases today sums up what matters today.
Clicking a release opens its page: historical progression, surprise history (actual figure against forecast), every past release, and above all the market impact analysis.
- Correlation
- Strength of the link between the release and your asset: strong, moderate or weak. The relation can be direct or inverse.
- Data points
- Number of past releases the measure is based on.
- Average move
- Average move of your asset after the release.
- Directional accuracy
- Share of releases after which the asset moved in the expected direction.
- Theoretical impact and actual move
- In blue, the expected impact score of each release; in green or red, what the price actually did afterwards.
Seasonality
Asset Seasonality shows the asset's average monthly performance over several years, its month-by-month heatmap and the overlay of years. Economic Seasonality does the same for economic indicators: their average value month by month, and the overlay of years.
News
The news feed filtered on the asset and, next to it, analyses published by financial sources.
Earnings and dividends
For a stock: each quarterly report with earnings per share (EPS) and revenue against analyst estimates, the quarterly trend, forward estimates and financial ratios. EPS above expectations is a "beat", below is a "miss". The Dividends tab gives the ex-dividend date (you must hold the stock before it), the payment date and the yield.
US Markets
The main US stocks, live. Clicking a row opens its details (profile, 30-day chart, key statistics). The heatmap view shows the market at a glance: green up, red down, size by market capitalisation.
Options Flow
Where options are positioned on the asset, and what that implies for market makers:
- GEX profile
- Gamma exposure by strike. Where it is strong, market makers' hedging can slow the price down or speed it up.
- Net GEX gauge
- The sign and size of total gamma exposure.
- Unusual activity
- Options trades that stand out by their size or their expiry.
On the chart, the GEX Heatmap and Niveaux gamma (gamma levels) indicators draw these levels straight onto the price.
Releases on the chart and as notifications
- The
Economic Newsindicator places releases on the chart time axis. - Kara can warn you a few minutes before each high-impact release, on the currencies you follow: see Alerts and notifications.
- The copier and the risk engine can close or block positions around these releases: see Position copier and Trading terminal.